Using PerfCollector with
InfluxDB and Grafana:
To collect Windows and SQL Server performance metric
data, the following steps needs to be completed:
2. Create a database
named metricsdb.
(a) Create data source as
metricsdb for PerfCollector.
(b) Import the
pre-designed dashboard.
4. Create a Windows
Scheduler Task to run PerfCollector continuously.
Installation
of InfluxDB:
Currently PerfCollector utilizes InfluxDB for data
storage. This guide will help you install InfluxDB on a Windows environment.
Please note that the InfluxDB can be install on different OS. Please see www.influxdata.com
for more details.
In this guide, we will install influxDB as a Windows
Server Service:
2.
Create a folder, for example, d:\influxdb
3.
Extract the binaries into this folder.
4.
Navigate to the d:\influxdb folder.
5.
Create three more folders as follows:
d:\influxdb\data
d:\influxdb\wal
d:\influxdb\meta
6.
Open the “influxdb.conf” configuration file with Windows WordPad.
Change the following sections as follows:
[meta]
dir = "d:\\influxdb\\meta"
[data]
dir = "d:\\influxdb\\data"
wal-dir = "d:\\influxdb\\wal"
7.
Open an elevated Windows command prompt and then
navigate to the folder, d:\influxdb
8.
Run the InfluxDB daemon as follows:
Influxd –config influxdb.conf
Creating a database for
PerfCollector:
1.
Open another elevated Windows command prompt.
2.
Navigate to d:\influxdb
3.
Run influx.exe on the command prompt.
4.
While you are in influx shell, create a database
with any name of your choice. Please note that the name is case sensitive.
5.
To create a database, execute, CREATE DATABASE metricsdb
Creating a Windows Service
for InfluxDB:
To create a Windows Service for InfluxDB, download the
open source nssm tool from https://nssm.cc/.
1.
Extract the contents in a folder, for example, d:\app.
2.
Open an elevated Windows command prompt and
navigate to d:\app
3.
Execute the following command to create a Windows
Service:
d:\app\nssm.exe install influxdb
4.
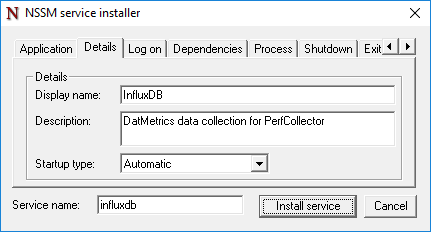
Fill in the input fields in the dialog box as
follows:
5.
Press “Install Service” when done. The nssm will
take you back to the command prompt.
6.
Now on the command prompt, execute net start influxdb to start the InfluxDB service.
Installation of Grafana:
To display PerfCollector metrics in-real time, the open
source web based metrics visualization tool “Grafana” is highly recommended. We
will be using nssm to create a Windows Service for Grafana.
Download the latest Windows build of Grafana from https://grafana.com.
1.
Create a folder, for example d:\grafana
2.
Extract the zipped file to this folder.
3.
Open an elevated Windows Command Prompt and navigate
to d:\app folder.
4.
Execute the following command:
d:\app\nssm.exe install grafana
5.
Fill in the input fields as shown in following
dialog boxes:
Importing
dashboard into Grafana:
Open a web browser and then browse to http://localhost:3000.
Use the default username (admin) and password (admin) to login to the Grafana
Interface. You will see the following Grafana web interface:
1.
Data Source for PerfCollector: A data source is
needed for the dashboard to display real-time metrics. Click the “Add data
source” and create a data source for InfluxDB database which is metricsdb.
2.
Import the dashboard: navigate to the Dashboard
menu and hit the “Import button” to import a pre-designed dashboard for
PerfCollector.
3.
Dashboard: From the import dialog box, browse
the dashboard JSON file and fill in the input fields as follows:


It can not be executed.
ReplyDeleteC:\Users\ksgon> C:\PerfCollector\PerfCollector.exe KSG-PC\SQLEXPRESS 5000 127.0.0.1:8086 metricsdb SQL “GEO\Geographic Survey App”
EAccessViolation:Access violation
You may have WMI corruption or Permission issue!
Delete