The upgraded version of OpenEye, the most efficient real-time monitoring,
visualization and performance analytical solution for on-premise Windows and
SQL Server built-on timescaledb, Grafana, Raw WMI, T-SQL and PL/pgSQL is now
available. The data collection process is completely agentless and can be
managed from a central location. The data collection process is written using
Free Pascal and it has no external dependencies and will run on all Windows version.
It is completely agentless, can collect data remotely (pull
method) from a single location. Low foot-print and light-weight with near zero
overhead on the monitored server.

 |
| Main Windows Server Performance dashboard |
Download:
- Download Link: https://bit.ly/3t5kj1l
- Update: 2023.27.10 (October 30, 2023) ** bug fix in dashboard **
- How to: how to use OpenEye
Data collection process and OpenEye:
While the OpenEye can run on any Windows Sever or Windows
Desktop; but Grafana and timescaledb can be docker based containerized
processes. Please note that the OpenEye uses Active Directory Authentication to
collect performance data from Windows and SQL Server, and as the Windows
container does not support Active Directory Authentication, therefore OpenEye.exe
process can’t be containerized. The AD Account which will be using to collect performance
data must have WMI Read permission as well as Read permission on SQL Server.
Windows scheduler task is highly recommended to run the data collection
process.
Using OpenEye in on-prem Windows Environment:
- Install and configure timescaledb.
- Install and configure Grafana.
- Use Command Prompt or PowerShell or create one or more Windows Task to collect performance data remotely.
In this example, we will use a Windows Server 2022 to
monitor few Windows and SQL Server instances and the Grafana and timescaledb will
be docker based container.
While the following guideline and configuration is based
on Windows 2022 Server, but you can use the same steps in any other version of Windows
Server or Windows Desktop edition.
Prepare a Windows Server for Docker Container:
- Whether the server is virtualized or not, make sure that the “Hardware Virtualization Feature” is enabled in the BIOS Level.

Enabling Hardware virtualization for CPU in VMWare vSphere - Install the WSL (Windows Subsystem for Linux 2). Open an administrative command or PowerShell prompt and then run, C:\>wsl --install.
- Download the Docker Desktop from: https://www.docker.com/products/docker-desktop/
- Install the Docker Desktop and reboot the server.
- After rebooting, the docker installation will download ubuntu automatically configured it for WSL.
- Check the WSL version at the command prompt: C:\>wsl -l -v
- Check the Docker version: C:\>docker version

WSL and Docker installation - Docker Desktop is now ready to create Grafana and timescaledb container.

Two containers are running in docker


Container Image:
All docker images can be pulled from the official docker registry.
If an image is not available in your machine or you are trying to create a container
for the first time, docker will pull the image from the docker hub automatically
and docker will then create a container from the pulled image. If we create a similar
container from a previously pulled image, docker will use the existing image
and will not pull a fresh image from the docker hub unless the image is changed
in docker hub or we explicitly mention a different image.
Installing and configuring a timescaledb container:
As the container is Ephemeral (stateless) in nature, therefore we
need external disk storage to preserve data and configuration for the container.
So, if a running container is terminated or removed or killed or Windows Server
gets rebooted, and later if the container starts running again by pointing to
the same storage volume, we will not lose any data as docker will map the
storage volume automatically. This mechanism is known as persistent volume in
docker or in Kubernetes.
In our example, we have a 200GB D: drive and we created a folder named
“D:\timescaldb”. We will map this folder to the container’s default data
directory “/var/lib/postgresql/data”. Following is the PowerShell Script to
create a timescaledb container.
 # https://docs.timescale.com/self-hosted/latest/install/installation-docker/

Clear-Host
$containerName ='timescaledb'

docker run -d `
    -e POSTGRES_PASSWORD=postgres `
    --name timescaledb -p 5432:5432 `
    --name=$containerName `
    --hostname $containerName `
    --volume D:\timescaledb/data:/var/lib/postgresql/data `
    timescale/timescaledb:latest-pg15
Installing and configuring a Grafana container:
We created another folder named “D:\grafana” to hold persistent data
for Grafana and it will hold configuration, dashboards and plugins of Grafana
outside of the container. In
our example, we will map the “D:\grafana” folder to the container’s internal
folder “/var/lib/grafana”.
# https://grafana.com/docs/grafana/latest/setup-grafana/installation/docker/

Clear-Host
$containerName ='grafana'
docker run -d `
    -p 3000:3000 `
    --name=$containerName `
    --hostname $containerName `
    --volume D:\grafana/data:/var/lib/grafana `
    grafana/grafana-enterprise
 |
| Using VSCode editor to create grafana container |
Creating database for OpenEye:
Make sure that both containers are up and running. If the containers
are functioning properly, you will see new files and folder in “D:\grafana” and
“D:\timescaledb”.
Creating database for OpenEye:
Make sure that both containers are up and running. If the containers are functioning properly, you will see new files and folder in “D:\grafana” and “D:\timescaledb”.
- Connect to the timescaledb using any PostgreSQL tool and create the database for OpenEye. The database name must be “openeyedb”.
- You can also create a user who will have Read and Write access to the database “openeyedb”.
- Assuming that you have already downloaded the zip file from the location I that have provided and it is in the D:\download. Extract the zip file in this folder.
- Open an Administrative Command prompt or Administrative PowerShell prompt and switch to the download folder.
- First, run the command, D:\download\>openeye.exe. This will cause to create a default “openeye.ini” file. You will also see on-screen syntax and example of OpenEye.
 |
| OpenEye Basic syntax |
- Open the “openey.ini” in a text editor and change the username and password who has access to the openeyedb.
[OpenEyeToPostgreSQL]
Server=192.168.0.110
Database=openeyedb
Username=postgres
Password=postgres
Port=5432
Server=192.168.0.110
Database=openeyedb
Username=postgres
Password=postgres
Port=5432
- Create tables in openeyebd, execute, D:\download>openeye create
- Convert postgres table to hyperTable, execute, D:\download>openeye ht
- On the command prompt run the following to connect a database server.
D:\download>openeye.exe FinSrv01 7000 SQL,1433\AGENT
D:\download>openeye.exe Net1SQL01 10000 SQL,2433\AGENT
- If everything went well then you will see an output similar to the following:
 |
Collecting Windows performance data |
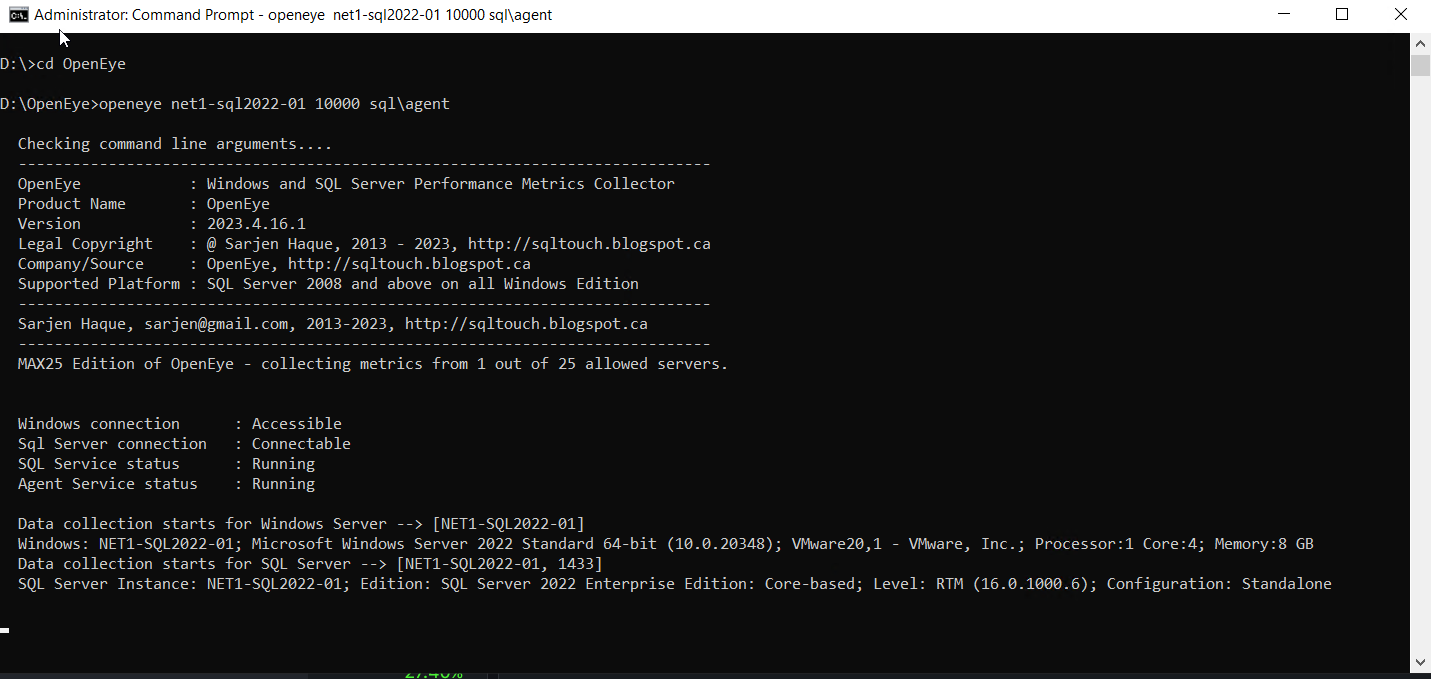 |
| Collecting Windows and SQL Server performance data |
- Open a browser, navigate to http://localhost:3000 or http:/IPAddress:3000 to open Grafana.
- Create a PostgreSQL connection in Grafana. Name the connection as “openeyedb”.
- Import the dashboards which are included in the download.
Other How-to and step-by-step guideline:
https://sqltouch.blogspot.com/2021/04/openeye-seeing-what-others-cannot-see.html