Total Pageviews

Sunday, June 23, 2013

SQL Server Port - How to open in Windows Firewall

In the IT security world, it is said that approximately 80% of all security breaches occur by insiders; directly or indirectly, willingly or unwillingly. Here our focus is local Windows firewall and to see whether it is correctly configured or not. It is essential to make sure that every Windows and SQL Server is secured and protected.

Although SQL Server resides inside a DMZ, it is still important to secure the SQL box for anything unforeseen and there is no reason to disable the windows firewall. By opening a couple of TCP or UDP ports without disabling the Windows Firewall will guarantee maximum protection of a SQL Box. 

In the following steps, we will configure Windows Firewall for the default port 1433 to allow traffic to pass through in Windows 2012 for SQL Server 2012.

Step by step guide:
1.      In “Server Manager” select “Local Server”. (figure # 1)
2.      From the “Tool” menu select “Windows Firewall with Advanced Security”.
3.      Select the “Inbound Rules” from the left hand side. From the Action pane select “New Rule”. (figure # 2)
4.      On the rule type dialog box, select “Port” and click next. (figure # 3)
5.      Select “TCP” and enter 1433 in the “Specific Local Ports” box. (figure # 4)
6.      On the next dialog box, select “Allow the connection”. (figure # 5)
7.      On the profile dialog box, select all three options: “Domain”, “Private” and “Public”. (figure # 6)
8.      On the last dialog box provide a name, e.g. “SQL Server Database Engine” and description. Then click finish button. (figure # 7)
9.      On the “Windows Firewall with Advanced Security”, click “Enable rule”. (figure # 8)

Figure # 1: Windows Firewall configuration for SQL Server Port 1433

Figure # 2: Windows Firewall configuration for SQL Server Port 1433

Figure # 3: Windows Firewall configuration for SQL Server Port 1433

Figure # 4: Windows Firewall configuration for SQL Server Port 1433

Figure # 5: Windows Firewall configuration for SQL Server Port 1433

Figure # 6: Windows Firewall configuration for SQL Server Port 1433

Figure # 7: Windows Firewall configuration for SQL Server Port 1433

Figure # 8: Windows Firewall configuration for SQL Server Port 1433

Sunday, June 16, 2013

Execution Plan and “SQL Sentry Plan Explorer” – it's like a hand of god!

There are numerous articles that have been written on how out-dated statistics cause severe performance issues. I am hesitant to add one more to that long list. However, this time I’ll be using “SQL Sentry Plan Explorer” to present the issue. Please note that I am not a sales agent or representative of “SQL Sentry”, I wanted to share its simplistic interface and usability. This tool is free, extremely powerful and it brings all the qualities a SQL Server Expert ever needs to analyze an Execution Plan; especially the ones who work on query performance tuning.

Sometime ago, I received a request from a source to help them out on a query performance issue. The issue they were experiencing was that the duration of a business critical query is degrading; and now it takes up to 5 minutes to complete!

I asked them to send me the XML output of the actual execution plan for that query. I opened the received query plan in both “SQL Sentry Plan Explorer” and “SSMS”; and found the root cause almost immediately – which was cardinality estimation issue due to “out-dated statistics”. So the ultimate recommendation was to update statistics. After updating, the query took less than 4 seconds.

Here, I am sharing the outputs from “SQL Sentry Plan Explorer” to show you how intuitive the tool is to understand an execution plan and identify any plan quality problems immediately. Following are a couple of screenshots you may find interesting.

Visit: SQL Sentry Plan Explorer

Some Screenshots:


Thursday, June 13, 2013

Performance issues from ORDER BY/GROUP BY - spills in tempdb

It is very common and expected to see a query containing ORDER BY or GROUP BY clause for displaying or grouping purposes. It is also common that developers use ORDER BY clause from a habit without considering its necessity. As a result, queries become slower overtime as the number of records increases.


The Last Supper - by Leonardo da Vinci
Grouping example in Art 
When a sort operation unable to acquire sufficient memory grant and it cannot be done in the memory and must happen in the tempdb. The heavier processing load inside the tempdb degrades overall SQL Server performance significantly. This situation is usually known as “spill to tempdb” or “spills in tempdb”. It is crucial to identify those sort warnings and avoid them whenever possible.

In my experience, I have seen ORDER BY/GROUP BY being used on a VARCHAR (8000) column while retrieving data; even unwisely used on a JOIN clause! Tweaking these queries is a bit tricky and most of the time it is impossible since the front-end application or business logic has already been built-in on this criterion. Creating an index on this column is not possible due to the 900 bytes restriction on an index key column.  So, other than crossing fingers, there is nothing much to do to resolve the performance issue immediately.  

Common Issues:
Following are some common issues that occur due to the misuse of ORDER BY/GROUP BY clause:
1.      Rapid tempdb data file growth.
2.      Increases disk I/O activities on tempdb and tempdb drive.
3.      Introduces lock contention and escalation.
4.      Increases memory grant for sort/hash operation.
5.      Introduces parallel query plan.

Detecting the Issue:
Detecting performance issues that arise from sort operation is quite simple and straight forward. Following are some tips to identify issues:
1.      Review the query and identify columns that are used on ORDER/GROUP clauses.
2.      Review the Execution plan and identify “sort” operators.
3.      Identify parallelism operators that perform the “distribute streams”, ”gather streams” and “repartition streams” in parallel execution plan.
4.      Use SQL Profiler Trace event “sort warnings”.
5.      Extended Event – “sort_warning”
6.      Use PerfMom or sys.dm_os_performance to track “worktables created/sec” and “workfiles created/sec”

To resolve the performance Issue:
To resolve performance issues that occur from a sort operation, a couple of actions can be taken as follows:
1.        Review the necessity of a sort operation in the query.
2.        Try to perform a sort operation in the front-end.
3.        Normalize the database schema.
4.        Create single or multi-column indexes.
5.        Apply filters on indexes.
6.        Use TOP (n) when there is an “ORDER BY”, if possible.
7.        Put more filters in the query to touch less data.
8.        Update distribution statistics.

Observing the behavior:
To observe the common issues with ORDER BY/GROUP BY operations, let’s create a database, table and a simple select statement against 500,000 records.

CREATE DATABASE testDB
GO
USE testDB
GO

SET NOCOUNT ON

IF OBJECT_ID('tblLarge') IS NOT NULL
    DROP TABLE tblLarge
GO

CREATE TABLE tblLarge
    (
      xID INT IDENTITY(1, 1) ,
      sName1 VARCHAR(100) ,
      sName2 VARCHAR(1000) ,
      sName3 VARCHAR(400) ,
      sIdentifier CHAR(100) ,
      dDOB DATETIME NULL ,
      nWage NUMERIC(20, 2) ,
      sLicense VARCHAR(25)
    )
GO

/*********************************
Add 500000 records
**********************************/

SET NOCOUNT ON
INSERT  INTO tblLarge
        ( sName1 ,
          sName2 ,
          sName3 ,
          sIdentifier ,
          dDOB ,
          nWage ,
          sLicense
        )
VALUES  ( LEFT(CAST(NEWID() AS VARCHAR(36)), RAND() * 50) ,    -- sName1
          LEFT(CAST(NEWID() AS VARCHAR(36)), RAND() * 60) ,    -- sName2
          LEFT(CAST(NEWID() AS VARCHAR(36)), RAND() * 70) ,    -- sName2
          LEFT(CAST(NEWID() AS VARCHAR(36)), 2) ,              -- sIdentifier    
          DATEADD(dd, -RAND() * 20000, GETDATE()) ,            -- dDOB
          ( RAND() * 1000 ) ,                                  -- nWage
          SUBSTRING(CAST(NEWID() AS VARCHAR(36)), 6, 7)        -- sLicense       
        )
GO 500000

/******************************************************
** Create a clustered index
******************************************************/
ALTER TABLE [tblLarge]
       ADD  CONSTRAINT [PK_tblLarge]
       PRIMARY KEY CLUSTERED ([xID] ASC)

/***************************************************************
** To resolve the sort warning, create a non-clustered index
***************************************************************/
CREATE NONCLUSTERED INDEX [IX_sName1]
       ON [tblLarge] ([sName1] ASC)


Simple SELECT Statement:
Following are some simple select statements to reproduce the behavior.

/******************************************************
** Simple select statement
******************************************************/
--First query
SELECT  xID ,
        sName1
FROM    tblLarge

-- Second query with - ORDER BY
SELECT  xID ,
        sName1
FROM    tblLarge
ORDER BY sName1

-- Third query - GROUP BY/ORDER BY
SELECT  sName1 ,
        COUNT(sName1) AS nCount
FROM    tblLarge a
GROUP BY sName1
ORDER BY sName1

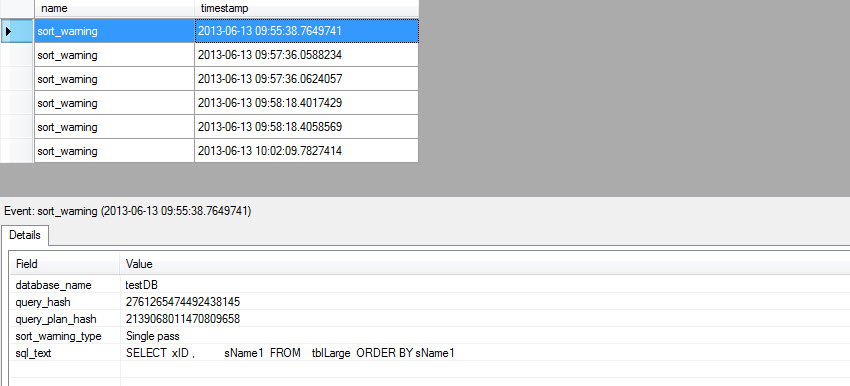
Using Extended Events (SQL 2012), SQL Profiler Trace and Execution Plan, “sort warning” are easily detectable and following are some outputs.

Figure#1: sort warning using Extended Events in SQL 2012


Figure#2A: sort warning detection using Execution Plan


Figure#2B: sort warning detection using Execution Plan

  
Figure#2: sort warning detection using SQL Profiler Trace


Learn More:

Tuesday, June 11, 2013

MAXDOP - What triggers Parallelism?

Charles Darwin was an English naturalist. He established that all species of life have descended over time from common ancestors and proposed the scientific theory that this branching pattern of evolution resulted from a process that he called natural selection. I am sure that everybody knows this theory and it is well accepted.

How does the above analogy works with SQL Server Query Optimizer? Query Optimizer of SQL Server obeys Charles Darwin theory while creating an execution plan before executing the SQL Query. SQL Server query optimizer is a cost based optimizer, what it means is that before creating an execution plan it considers a number of facts and factors to produce a trivial and “good enough” plan. In the following short list, we can identify those:

1.      Construction of the query.
2.      Number of records, data length, and size of the table.
3.      Appropriate indexes and up-to-date statistics.
4.      I/O, CPU and Memory.

MAXDOP in OLTP:
In an OLTP environment, it is expectable that all queries and transactions are efficient and quick enough to finish its execution within 5 seconds. If it does not then SQL Server will take advantage of parallelism based on the query cost and MAXDOP setting.

There are a vast number of considerations, recommendations and concerns as well as what will be the settings of MAXDOP in OLTP environment? In OLTP implementation, it is expected that all queries have been written with performance in mind while adhering to the best practices. But in the real world this is not the case. Some queries are written poorly or are performing poorly because of the lack of appropriate indexes, out dated statistics, memory pressure, CPU bottleneck, slow I/O response, and so on.  

How MAXDOP works?
MAXDOP is the maximum number of worker threads SQL Server Query Optimizer can use to execute a query. Each thread will go to each processor’s core during an execution of a parallel query. The MAXDOP = 0 (zero) means that the Query Optimizer is flexible to use the required number of threads to execute the query based on a set of predefined rules and a mechanism built-in in SQL Server.  

Besides the server wide settings, Query hint (OPTION (MAXDOP n)) can be used to control parallel execution of a query. “Cost threshold for parallelism” is another server wide setting that can be utilized to control parallelism behavior. 

"At execution time, if parallel execution is warranted, the Database Engine determines the optimal number of threads and spreads the execution of the parallel plan across those threads in its each execution. When a query or index operation starts executing on multiple threads for parallel execution, the same number of threads is used until the operation is completed. The Database Engine re-examines the optimal number of thread decisions every time an execution plan is retrieved from the plan cache. For example, one execution of a query can result in the use of a serial plan, a later execution of the same query can result in a parallel plan using three threads, and a third execution can result in a parallel plan using four threads".

What triggers Parallelism?
There are a couple different and specific reasons in OLTP system that triggers SQL Server to choose parallel execution of query to speedup data retrieval process. The following are a couple of important key factors for which SQL Server database engine chooses parallel query execution. 

1.      The query contains ORDER BY or GROUP BY clause. This means excessive sort operation. There are no appropriate indexes to support the sort operation.
2.      Skewed data; meaning a column contains substantial number of duplicate records.
3.      Memory grant is in-sufficient to execute the query. All sort operation requires extra memory and thus causes a “spill to tempdb”.
4.      Not updated distribution statistics.
5.      Processing huge number of records.

Symptoms and detecting Parallelism Issue:
Usually CXPACKET waittype can be used to monitor parallel query execution behavior in OLTP systems. But keep in mind that CXPACKET does not necessarily indicate that parallelism is an issue. This wait means that the parent thread is waiting to synchronize all output from the child threads. However, if you see SQL blocking on CXPACKET, it indicates that the SQL Server is facing resource contention such as lack of indexes, out-dated statistics, I/O and CPU bottleneck, parameter sniffing issue, excessive sort operation and so on.

Generally and as per SSMS implementation, the combined waits from EXCHANGE, EXECSYNC and CXPACKET can be used to measure and identify whether parallelism is an issue or not.  

By increasing MAXDOP, if you see that the CPU usages goes high and the number of waiting tasks increases, this generally indicates that there is a parallelism issue. “Avg waiting tasks” in “Activity Monitor” can be used to observe the behavior quickly. Following simple queries are also good to observe the parallel threading behavior

SELECT  SUM(s.runnable_tasks_count)
FROM    sys.dm_os_schedulers s
WHERE   s.[scheduler_id] < 255

SELECT  wait_type ,
        waiting_tasks_count ,
        ( wait_time_ms - signal_wait_time_ms ) AS resource_wait_time_ms
FROM    sys.dm_os_wait_stats
WHERE   wait_type IN ( 'EXCHANGE', 'EXECSYNC', 'CXPACKET' )
ORDER BY resource_wait_time_ms DESC

You can also use my simple monitoring tool to detect and visualize parallelism issues. Please note that the excerpted scripts from SSMS were used to build this section.


Recommendations:
In OLTP systems using MAXDOP, value 1 is recommended by Microsoft and all the industry experts. However some queries will be benefited from higher value if you are not able to tune your queries, unable to create/update appropriate indexes or statistics. If you notice a fewer number of “Worker Threads” then MAXDOP =1 is more suitable and based on the workload it can be increased slowly.  

Reference:
Degree of Parallelism
http://msdn.microsoft.com/en-us/library/ms188611(v=sql.105).aspx

Understanding and Controlling Parallel Query Processing in SQL Server
http://msdn.microsoft.com/en-us/library/gg415714.aspx

Thursday, May 16, 2013

WRITELOG waittype - Implicit vs. Explicit Transaction: disk or coding issue?

In a OLTP system where concurrency is high observing WRITELOG waittype is normal for a short period of time during peak usage. Generally, a high value of this waittype indicates slow response of the application. So, observing this waittype for a longer period of time and repeatedly for DML operations such as MERGE, INSERT, UPDATE and DELETE, obviously this indicates two specific issues:

1.      Disk I/O sub-system
2.      Transaction handing

If the underlying disk sub-system is the best in the industry and configured correctly, investigation shows nothing suspicious around I/O and if we still see the WRITELOG waittype then it is obviously the result of poor or improper handling of Transactions in a SQL batch.

Figure #1: WRITELOG waittype in a live system
Let’s explain what WRITELOG waittype is. This is a log management system waiting for dirty data pages to write on the disk. This waittype indicates that the SPID is waiting for a transaction log I/O request to be completed.  Thus if the number of WRITELOG waittype is high that means there are a number of requests in the queue which are processing slowly. Although, many experts and even MS KB article (KB822101) indicates it is a disk bottleneck, in reality this may not be the case unless your disk system is IDE or SATA based or configured incorrectly. We need to investigate one more area before confirming that the disk is an issue.

Implicit and explicit transaction:
As the WRITELOG waittype is related to the transaction log management system, let’s try to understand the difference between the two.

SQL Server handles two types of transaction mode:
(a)   Implicit transaction
(b)   Explicit transaction

Implicit transaction: In Implicit transaction mode, the instance of the SQL Server Database Engine automatically starts a new transaction after the current transaction is committed or rolled back for each DML statement. We do not need to define the start of a transaction; each statement level transaction will be committed or rolled back automatically.

Implicit transaction can be turned on or off per batch basis. We can use the “SET IMPLICIT_TRANSACTIONS ON/OFF” statement to turn implicit transaction mode off. We can use the “COMMIT TRANSACTION” or “ROLLBACK TRANSACTION” statements to end each transaction.

Explicit transaction: An explicit transaction is one in which we explicitly define both the starting and ending of the transaction. To start an explicit transaction, we can use “BEGIN TRANSACTION” and then complete the transaction by using “COMMIT TRANSACTION” or “ROLLBACK TRANSACTION”.

The main difference between Implicit and Explicit transaction is that implicit transaction is auto, controlled by SQL Server Engine and statement level transaction, whereas explicit transaction is user defined and batch-scoped transaction. Some key comparisons are follows:

Indicator
Implicit Transaction
Explicit Transaction
Scope
Statement level
Batch level
Log generation
continuous chain of transactions
One transaction log entry
Log I/O
For each statement gets one I/O
Entire batch needs one I/O
WRITELOG Waittype
Sustained period of time
N/A or unless there is real disk issue
Response/duration
Longer due to several I/O activities
Fast, less I/O activities
T-Log Restore
Long, Redo/undo phase
Short redo/undo phase
Impact on T-Log
Extremely high
Less and insignificant
Write Duration
Longer and slow
Shorter and fast


The application which is utilizing the Implicit Transaction mechanism actually makes the I/O system busy and degrades application response time dramatically. As a result, various disk related performance counters show significantly high values and we start believing that the disk is the bottleneck.

Observing the WRITLOG waittype:
In the following test we will review how implicit and explicit transaction incurs WRITELOG waittype. The given script can be executed in any version of SQL Server and with any kind of disk system to understand the behavior.

Complete T-SQL Code to produce the behavior:
/******************************************************
** Implicit vs Explicit Transaction
** Author: Sarjen Haque
** Apply to: SQL 2005 to 2012
******************************************************/
DBCC SQLPERF('sys.dm_os_wait_stats', CLEAR);

IF OBJECT_ID('tempdb..#wait') IS NOT NULL
   DROP TABLE #wait
GO

/*************************************
** Create a test database
*************************************/
USE [master]
GO
IF EXISTS ( SELECT  name
            FROM    sys.databases
            WHERE   name = N'TestDB' )
   BEGIN
         ALTER DATABASE [TestDB] SET  SINGLE_USER WITH ROLLBACK IMMEDIATE
         DROP DATABASE [TestDB]
   END
GO

CREATE DATABASE TestDB
GO

USE TestDB
GO
/*************************************
** Create a a table
*************************************/
SET NOCOUNT ON
IF OBJECT_ID('tblLarge') IS NOT NULL
   DROP TABLE tblLarge
GO

CREATE TABLE tblLarge
       (
         xID INT IDENTITY(1, 1) ,
         sName1 VARCHAR(100) ,
         sName2 VARCHAR(1000) ,
         sName3 VARCHAR(400) ,
         sIdentifier CHAR(100) ,
         dDOB DATETIME NULL ,
         nWage NUMERIC(20, 2) ,
         sLicense VARCHAR(25)
       )
GO
/*************************************
** Perform a checkpoint
*************************************/
CHECKPOINT


/*************************************
** Collect initial wait stats
*************************************/
SELECT  'w1' WaitRun ,
        wait_type ,
        wait_time_ms / 1000.0 AS WaitSec ,
        ( wait_time_ms - signal_wait_time_ms ) / 1000.0 AS ResourceSec ,
        signal_wait_time_ms / 1000.0 AS SignalSec ,
        waiting_tasks_count AS WaitCount
INTO    #Wait
FROM    sys.dm_os_wait_stats
WHERE   wait_type LIKE 'WRITELOG%'

GO
/*************************************
** Using explicit Transaction
*************************************/
SET NOCOUNT ON
USE TestDB
GO

DECLARE @n INT
SET @n=1

BEGIN TRANSACTION
WHILE @n <= 10000
      BEGIN
            INSERT  INTO tblLarge
                    ( sName1 ,
                      sName2 ,
                      sName3 ,
                      sIdentifier ,
                      dDOB ,
                      nWage ,
                      sLicense
                    )
            VALUES  ( LEFT(CAST(NEWID() AS VARCHAR(36)), RAND() * 50) ,    -- sName1
                      LEFT(CAST(NEWID() AS VARCHAR(36)), RAND() * 60) ,    -- sName2
                      LEFT(CAST(NEWID() AS VARCHAR(36)), RAND() * 70) ,    -- sName2
                      LEFT(CAST(NEWID() AS VARCHAR(36)), 2) ,              -- sIdentifier    
                      DATEADD(dd, -RAND() * 20000, GETDATE()) ,            -- dDOB
                      ( RAND() * 1000 ) ,                                  -- nWage
                      SUBSTRING(CAST(NEWID() AS VARCHAR(36)), 6, 7)        -- sLicense       
                    )
            SET @n = @n + 1
      END
COMMIT TRANSACTION

GO
/***************************************
** Collect wait stats for Explicit TRN
***************************************/
INSERT  INTO #wait
        SELECT  'w2' WaitRun ,
                wait_type ,
                wait_time_ms / 1000.0 AS WaitSec ,
                ( wait_time_ms - signal_wait_time_ms ) / 1000.0 AS ResourceSec ,
                signal_wait_time_ms / 1000.0 AS SignalSec ,
                waiting_tasks_count AS WaitCount
        FROM    sys.dm_os_wait_stats
        WHERE   wait_type LIKE 'WRITELOG%'
GO
/*****************************************
** Check for Log flush for Explicit TRN
*****************************************/
SELECT  'Explicit' AS Transaction_Type ,
        SPID ,
        Operation ,
        COUNT(Operation) [OperationCount] ,
        [Transaction Name] ,
        COUNT([Transaction Name]) AS [TransactionNameCount]
FROM    ::
        fn_dblog(NULL, NULL)
WHERE   operation LIKE '%LOP_BEGIN_XACT%'
        AND [SPID] = @@spid
        AND [SPID] IS NOT NULL
GROUP BY SPID ,
        Operation ,
        [Transaction Name]
GO

/************************************
** Using implicit Transaction
************************************/
SET NOCOUNT ON
USE TestDB
GO

DECLARE @n INT
SET @n=1

WHILE @n <= 10000
      BEGIN
            INSERT  INTO tblLarge
                    ( sName1 ,
                      sName2 ,
                      sName3 ,
                      sIdentifier ,
                      dDOB ,
                      nWage ,
                      sLicense
                    )
            VALUES  ( LEFT(CAST(NEWID() AS VARCHAR(36)), RAND() * 50) ,    -- sName1
                      LEFT(CAST(NEWID() AS VARCHAR(36)), RAND() * 60) ,    -- sName2
                      LEFT(CAST(NEWID() AS VARCHAR(36)), RAND() * 70) ,    -- sName2
                      LEFT(CAST(NEWID() AS VARCHAR(36)), 2) ,              -- sIdentifier    
                      DATEADD(dd, -RAND() * 20000, GETDATE()) ,            -- dDOB
                      ( RAND() * 1000 ) ,                                  -- nWage
                      SUBSTRING(CAST(NEWID() AS VARCHAR(36)), 6, 7)        -- sLicense       
                    )
            SET @n = @n + 1
      END

GO
/***************************************
** Collect wait stats for Implicit TRN
***************************************/
INSERT  INTO #wait
        SELECT  'w3' WaitRun ,
                wait_type ,
                wait_time_ms / 1000.0 AS WaitSec ,
                ( wait_time_ms - signal_wait_time_ms ) / 1000.0 AS ResourceSec ,
                signal_wait_time_ms / 1000.0 AS SignalSec ,
                waiting_tasks_count AS WaitCount
        FROM    sys.dm_os_wait_stats
        WHERE   wait_type LIKE 'WRITELOG%'
GO

/************************************
** Check for Log flush
************************************/
SELECT  'Implicit' AS Transaction_Type ,
        SPID ,
        Operation ,
        COUNT(Operation) [OperationCount] ,
        [Transaction Name] ,
        COUNT([Transaction Name]) AS [TransactionNameCount]
FROM    ::
        fn_dblog(NULL, NULL)
WHERE   operation LIKE '%LOP_BEGIN_XACT%'
        AND [SPID] = @@spid
        AND [SPID] IS NOT NULL
GROUP BY SPID ,
        Operation ,
        [Transaction Name]
     
GO

/********************************************************
** Compare the waittype collection
********************************************************/
SELECT  a.wait_type ,
        'Explicit Transaction' AS Transaction_Type ,
        ( b.WaitSec - a.WaitSec ) AS TotalwaitSec ,
        ( b.ResourceSec - a.ResourceSec ) AS TotalResourceSec ,
        ( b.SignalSec - a.SignalSec ) AS TotalSignalSec ,
        ( b.WaitCount - a.WaitCount ) AS TotalWaitCount
FROM    ( SELECT    *
          FROM      #wait
          WHERE     waitrun = 'w1'
        ) a
        JOIN ( SELECT   *
               FROM     #wait
               WHERE    waitrun = 'w2'
             ) b ON a.wait_type = b.wait_type
UNION ALL
SELECT  a.wait_type ,
        'Implicit Transaction' AS Transaction_Type ,
        ( b.WaitSec - a.WaitSec ) AS TotalwaitSec ,
        ( b.ResourceSec - a.ResourceSec ) AS TotalResourceSec ,
        ( b.SignalSec - a.SignalSec ) AS TotalSignalSec ,
        ( b.WaitCount - a.WaitCount ) AS TotalWaitCount
FROM    ( SELECT    *
          FROM      #wait
          WHERE     waitrun = 'w2'
        ) a
        JOIN ( SELECT   *
               FROM     #wait
               WHERE    waitrun = 'w3'
             ) b ON a.wait_type = b.wait_type

GO

Figure #2: implicit vs. explicit

Figure #2: implicit vs. explicit

Figure #3: implicit vs. explicit 

 
Analysis:
The analysis is simple and easy to understand from the output. From the above pictures we can see that the implicit transaction is always slow, signal wait is high and requires more I/O activities to complete a task.

Summary:
We saw that WRITELOG waittype does not necessarily indicate a disk throughput problem. It is the SQL Server Transaction Log management system who is doing more work to write each transaction into the log file. So before concluding, I would recommend to review your application code and see if you can use explicit transactions. I am sure that even though you use an Enterprise Class SSD system, implicit transaction may not improve the application performance dramatically.