Total Pageviews

Wednesday, November 19, 2025

PowerShell MongoDB Backup Script

Automated backup solution for MongoDB on Windows

This PowerShell script automates MongoDB backups on Windows, handling backup creation, verification, retention management, and logging. It runs quietly in the background with comprehensive logging to text files and Windows Event Log.

⬇️ Download Script Files  

Purpose

Ensures reliable MongoDB database backups with these capabilities:

  • Support local or remote MongoDB servers
  • Automated retention and cleanup
  • Detailed activity logging for auditing
  • Optional backup verification
  • Windows Event Log integration

Key Features

Flexible Target Configuration

  • Backup local or remote MongoDB instances
  • Default port 27017 with custom port support
  • Username/password authentication support

Selective or Full Backups

Backup all databases, specific databases, or selected collections. Oplog support (--oplog) enables point-in-time consistent backups.

Backup Directory and Naming

Backups stored in configurable directory (default: D:\MongoBackups) with timestamped folders:

D:\MongoBackups\mongodump_2025-11-09_080530am

Logging and Event Recording

All activities logged to daily text files and Windows Application Event Log with timestamps and status.

2025-11-19 07:57:08 AM - INFO - Server: localhost:27017 | Backup Path: D:\MongoBackups\mongodump_20251119_075708am
2025-11-19 07:57:08 AM - INFO - Backup Scope: Entire database 'openeyedb'
2025-11-19 07:57:08 AM - INFO - Retention: Keep 10 latest backups
2025-11-19 07:57:08 AM - INFORMATION - Event Log: Starting MongoDB backup from server: localhost:27017 to D:\MongoBackups\mongodump_20251119_075708am
2025-11-19 07:57:08 AM - INFO - Applying retention policy...
2025-11-19 07:57:08 AM - INFO - Deleted old backup: mongodump_20251109_091920pm
2025-11-19 07:57:08 AM - SUCCESS - Retention cleanup completed. Deleted 1 old backups
2025-11-19 07:57:08 AM - SUCCESS - Created new backup folder: D:\MongoBackups\mongodump_20251119_075708am
2025-11-19 07:57:08 AM - INFO - Using authentication for user: backupuser
2025-11-19 07:57:08 AM - INFO - Starting MongoDB backup process...
2025-11-19 07:57:09 AM - INFORMATION - Event Log: MongoDB backup completed successfully. Backup size: 4.02 MB. Location: D:\MongoBackups\mongodump_20251119_075708am
2025-11-19 07:57:09 AM - SUCCESS - Backup completed successfully. Size: 4.02 MB
2025-11-19 07:57:09 AM - INFO - Verifying backup...
2025-11-19 07:57:09 AM - SUCCESS - Backup verification successful: Found 5 BSON/JSON files
2025-11-19 07:57:09 AM - INFORMATION - Event Log: Backup verification completed successfully
2025-11-19 07:57:09 AM - SUCCESS - === MongoDB Backup Completed Successfully ===
2025-11-19 01:42:44 PM - INFO - === MongoDB Backup Started ===
2025-11-19 01:42:44 PM - INFO - Server: localhost:27017 | Backup Path: D:\MongoBackups\mongodump_20251119_014244pm
 

Data Retention Policy

Automatic cleanup of old backups based on retention settings:

  • RetentionDays: Days of backups to keep (default: 30)
  • RetentionCount: Number of recent backups to keep (takes precedence)

Log File Management

  • Maximum 10 log files retained
  • Each log file limited to 25 MB
  • Automatic rotation and deletion of old logs

Optional Backup Verification

When enabled, script verifies backup folders contain valid BSON/JSON files and metadata, with results logged to both text files and Windows Event Log.

Error Handling

All errors recorded in both text logs and Windows Event Log. Common issues include authentication failures, incorrect parameters, and insufficient disk space.

Automation and Scheduling

Can be executed manually or via Windows Task Scheduler for automatic operation. Runs silently when scheduled while maintaining complete activity logging.

Example Execution Scenarios

#############################################
# === Usage Example ===
#############################################
# Backup everything on a localhost
Backup-MongoDB 

# Basic backup without oplog and retention:
Backup-MongoDB -RetentionDays 15

# Keep only 10 latest backups:
Backup-MongoDB -RetentionCount 10

# Remote server with all features:
Backup-MongoDB -Server "SHB55" -Username "admin" -Password "secret" -UseOplog -RetentionCount 7 -VerifyBackup

# Custom backup directory with retention:
Backup-MongoDB -BackupDir "E:\MongoDB\Backups" -RetentionDays 30

# With backup verification:
Backup-MongoDB -Server "localhost" -VerifyBackup

# Backup multiple collections
Backup-MongoDB -Database "mydb" -Collections "users","orders","products"

# Backup single collection
Backup-MongoDB -Database "mydb" -Collections "users"

# Backup single database
Backup-MongoDB -Database testDB -Username "backupuser" -Password "SecureBackupPass123!" 

# Backup single database
Backup-MongoDB -Database openeyedb -Username "backupuser" -Password "SecureBackupPass123!"  -VerifyBackup -RetentionCount 10 

Event Log Entries

Event ID Type Description
1000InformationBackup started
1001InformationBackup completed successfully
1002InformationBackup verification passed
1003WarningBackup verification failed
2001ErrorBackup process failed

Create a Backup User in MongoDB

# Connect mongodb and create backup user
mongosh -u admin -p shb12345 --authenticationDatabase admin
use admin

db.createUser({
  user: "backupuser",
  pwd: "SecureBackupPass123!",
  roles: [
    { role: "backup", db: "admin" },
    { role: "restore", db: "admin" },
    { role: "readAnyDatabase", db: "admin" }
  ]
}) 

Summary

The MongoDB Backup Script provides automated, consistent backups for local and remote MongoDB servers with built-in retention management, detailed logging, and optional verification for reliable data protection with minimal maintenance.

Sunday, November 16, 2025

OpenEye: Enterprise-Grade Monitoring at Near-Zero Cost

Complete visibility into your Windows and SQL Server environments

Achieve complete visibility into your Windows and SQL Server environments with a powerful, self-managed, and agentless monitoring solution. OpenEye is a rearchitected, purpose-built performance metrics collector that delivers fast data processing and ingestion without the overhead.

  • Effortless Deployment: Get started in minutes with no complex setup or agents to install.
  • Real-Time Insights: Gain immediate visibility with live performance dashboards.
  • Proactive Monitoring: Identify and address issues before they impact your systems.
  • Cost-Effective: Enjoy enterprise-grade capabilities without the enterprise price tag.
OpenEye Dashboard Example
OpenEye Performance Metrics

What is OpenEye?

OpenEye is a 64-bit, multi-threaded performance data collector for Windows and SQL Server. Using DCOM and command-line operation, it runs on a single central server (Windows Server or Desktop) to gather real-time performance data from hundreds of remote servers. It has no dependencies, making it simple to deploy anywhere.

Download OpenEye 2025

Get started with enterprise monitoring today

Download OpenEye

Version 2.1 | Windows 64-bit | ZIP Archive| November 2025

Prerequisites

OpenEye uses two open-source applications for data storage and visualization. Both are easy to install and require no specialized knowledge. Download, install, and configure these applications on a network-accessible server before running OpenEye.

1 Install QuestDB

A high-performance time-series database for data ingestion.

Download: https://questdb.com

2 Install Grafana

A leading platform for data visualization and dashboards.

Download: https://grafana.com

3 Install QuestDB Data Source Plug-in

Required for Grafana to connect to QuestDB.

Download: QuestDB Grafana Plug-in

Quick Start Guide

Let's set up monitoring for 25 SQL Servers and their underlying Windows hosts from a central location.

Step One: Configure QuestDB and Grafana

Install QuestDB

Follow the QuestDB installation guide to install it on a server in your network. You can run it as a service or from the command line.

Install Grafana

Similarly, install Grafana on a server in your network, running it as a service or from the command line.

Install the Plug-in

Install the QuestDB data-source plug-in in your Grafana instance.

Add Data Source

In Grafana, create a new data source named qdbopeneye using the QuestDB plug-in. No username or password is required.

Import Dashboard

Import the pre-configured dashboard provided in the OpenEye.zip file into Grafana.

Step Two: Configure and Run OpenEye

Download & Extract

Download the OpenEye.zip file and extract it to a folder, e.g., D:\OpenEye.

Generate Config Files

Run OpenEye.exe twice from the command prompt. This generates the required perf_config.txt and perf_server.txt files.

Configure QuestDB Connection

Open perf_config.txt and update the QuestDB server details:

# QuestDB host name or IP address
QUEST_DB_HOST=localhost
# InfluxDB Line Protocol (ILP/HTTP) port (9000 is the default)
QUEST_DB_PORT=9000

Leave all other parameters unchanged for now.

Add Servers to Monitor

Open perf_server.txt and add your servers using the format described in the next section.

Launch

Start D:\OpenEye\OpenEye.exe.

Important Notes

Permissions: OpenEye uses Integrated Security. The account running it must have WMI read-only permissions on target Windows servers and VIEW SERVER STATE permission on target SQL Servers.

Run as a Service: To run OpenEye as a Windows service, use a tool like NSSM (www.nssm.cc).

Data Ingestion: OpenEye uses the InfluxDB Line Protocol (ILP) over HTTP to write to QuestDB. All tables are created automatically via a schema-on-write mechanism.

Adding or Removing Servers

You can dynamically add or remove servers from monitoring.

  1. Edit the perf_server.txt file.
  2. To add a server, insert a new line.
  3. To remove a server, comment out the line (with a #) or delete it.
  4. OpenEye automatically detects these changes. The frequency is controlled by the DURATION_TO_REFRESH_SERVER_MIN parameter (default: 5 minutes).
  5. For immediate effect, stop and restart the OpenEye process.

Server Configuration Format

The perf_server.txt file uses the following format:

# Duration | ServerName[,Port] | WIN or SQL
#
# Duration = Collection interval in seconds (0 = use global default)
# ServerName = Windows hostname or IP
# SQLServer[,Port] = SQL Server in format Server\Instance, optional port
# WIN = Collect Windows performance data only
# SQL = Collect both Windows and SQL performance data

Examples

Configuration Description
5|SRV1967|WIN Monitor Windows server SRV1967 every 5 seconds.
5|SRV1967|SQL Monitor SQL Server SRV1967 (default instance) every 5 seconds.
10|SRV1967,2345|SQL Monitor SQL Server on SRV1967 port 2345 every 10 seconds.
0|SRV1967\SQL2025|SQL Monitor named instance SQL2025 using the global collection interval.
15|SRV1967\SQL2022|SQL Monitor named instance SQL2022 every 15 seconds.

Key Configuration Parameters

Parameter Description
DURATION_TO_REFRESH_SERVER_MIN How often (in minutes) OpenEye reloads the perf_server.txt file to add new servers or remove commented-out ones.
OPENEYE_RESET_INTERVAL_MIN & OPENEYE_RESET_AT Controls how often OpenEye performs a full reset.
  • OPENEYE_RESET_INTERVAL_MIN=720 (12 hours)
  • OPENEYE_RESET_AT=12:01AM (Resets daily at 12:01 AM). If blank, the interval parameter is used.
During a reset, OpenEye restarts all monitoring threads, re-reading all configuration files.

External TSQL and WQL Queries

OpenEye allows you to extend its functionality by using your own custom queries, and can even replace its built-in data collection.

Configuration (perf_config.txt)

# Enable/Disable built-in collectors
USE_BUILTIN_WMI_COLLECTOR=YES
USE_BUILTIN_SQL_COLLECTOR=YES
# Enable external custom queries
USE_EXTERNAL_WMI_QUERY=YES
USE_EXTERNAL_SQL_QUERY=YES

Query File Format

  1. Place WQL queries in the \wqlqueries folder and TSQL queries in the \sqlqueries folder.
  2. WQL File Name Format: wql_[CustomName]-[Duration].txt
  3. TSQL File Name Format: sql_[CustomName]-[Duration].txt
    • The prefix (wql_/sql_) is mandatory.
    • [CustomName] defines the resulting table name in QuestDB.
    • [Duration] is the execution interval in seconds. If omitted, the global default is used.

Sample Queries (included in the package)

WQL Queries

  • wql_transactions-15.txt → Creates table wql_transactions, runs every 15 seconds.
  • wql_volume-10.txt → Creates table wql_volume, runs every 10 seconds.

TSQL Queries

  • sql_host_memory-30.txt → Creates table sql_host_memory, runs every 30 seconds.
  • sql_single_useplan-60.txt → Creates table sql_single_useplan, runs every 60 seconds.
  • sql_waittype-15.txt → Creates table sql_waittype, runs every 15 seconds.

Note: For SQL Server-related WMI classes, use the placeholder [WQLSQLName] in your query. OpenEye will automatically substitute the correct WMI class name based on the server and instance defined in perf_server.txt.

Monitoring Hundreds of Servers

Scaling OpenEye for Large Environments

While OpenEye can collect performance metrics from hundreds of servers without restrictions, each OpenEye process is optimized to monitor 32-48 remote servers due to its DCOM and RPC-based architecture. For optimal performance, we recommend limiting each instance to a maximum of 48 servers.

To monitor 200 servers from a central location:

  1. Divide your 200 servers into 5 groups of 40 servers each
  2. Create a main directory: D:\OpenEye
  3. Create 5 sub-folders: D:\OpenEye\sub-01, D:\OpenEye\sub-02, etc.
  4. Copy the perf_config.txt file into each sub-folder
  5. Create individual perf_server.txt files in each sub-folder with the corresponding server groups
  6. Copy the \wqlqueries and \sqlqueries folders along with OpenEye.exe to each sub-folder
  7. Use NSSM to create a unique Windows service for each sub-folder instance
  8. Optionally, use OPENEYE_SERVICE_NAME='Service Name' in your config to identify each service, or leave blank to use the sub-folder name
OpenEye Scaling Architecture
Sample OpenEye Management panel

Note: This distributed approach ensures optimal performance and resource utilization when monitoring large server environments.

Wednesday, August 20, 2025

SQLEventMonitor – real-time monitoring and email alerting hundreds of SQL Server instances simultaneously

SQL Server Event Monitor – Real-Time Monitoring and Email Alerting for Hundreds of SQL Server Instances Simultaneously

SQL Server Event Monitor is a lightweight, portable, and highly efficient multi-threaded application—distributed as a single executable file - designed to monitor hundreds of SQL Server instances simultaneously. It leverages fully customizable, user-defined T-SQL queries (sample included) to collect precisely the data you need.

Its power lies in a simple yet flexible text-based configuration system, enabling you to:

  • Define target SQL Server instances,
  • Set custom monitoring intervals,
  • Fine-tune a wide range of operational behaviors.

Additionally, SQL Server Event Monitor is SQL Server version-aware: it automatically detects the version of each target instance and executes the appropriate version-specific query, ensuring compatibility and optimal performance across SQL Server 2008 through SQL Server 2025 (and beyond).

Download from Google Drive: https://drive.google.com/drive/u/1/folders/1_Xy5GCTbpwSO218eJ-rOWoSb3VBoXast
Updated: October 2025

With SQLEventMonitor, you can:

  • Send real-time email alerts
  • Log events directly into a SQL Server database for dashboards and analytics
  • Easily adjust monitoring parameters on the fly

All of this is presented in a simple and intuitive text-based interface, designed to make your operational tasks effortless while providing deep insights into your SQL Server environment.

Email Alerting: To complement the process eco-system, an intelligent PowerShell automation script is included for real-time alerting. As soon as new events are captured and written to the SQL Server repository, the script can trigger highly configurable email notifications.

figure #1: Sample email alert processed by the PowerShell Script

Administrators can easily control email behavior via a text file - from choosing which servers to monitor, which events to alert on, and even applying suppression windows to prevent repeated alerts for the same issue.

The result: a lightweight, flexible, and scalable SQL Server monitoring solution that puts you in full control.

Download Link:

Download SQLEventMonitor

Quick Start

  1. Download and unzip the package (it also contains sample queries).
  2. Run the executable for the first time – this will automatically create all required supporting files.
  3. Edit configuration settings in "event_config.txt".
  4. Add SQL Server instances to monitor in "event_server.txt".
  5. Create the alert repository table by executing the script in "event_table_script.txt" on your target SQL Server.
  6. Configure monitoring queries in "event_query.txt". You may use the supplied predefined queries, adjust them, or write your own.
  7. Run the executable again – it will begin collecting SQL Server diagnostic data for alerting purposes.
  8. For more details, refer to the comprehensive usage guide provided below.

Updated Version (October 2025):

The updated application is now version-aware, meaning it can execute different T-SQL queries tailored to specific versions of SQL Server instances.

By default, the application uses the generic query file event_query.txt, which is compatible with any SQL Server version. This file is applied to all instances listed in event_server.txt unless a version-specific override exists.

If a version-specific query file is present, the application will use it instead for the corresponding SQL Server version. The naming convention for these files is:

- event_query.txt — Default (used for all versions if no specific file exists)  
- event_query-10.txt — SQL Server 2008  
- event_query-11.txt — SQL Server 2012  
- event_query-12.txt — SQL Server 2014  
- event_query-13.txt — SQL Server 2016  
- event_query-14.txt — SQL Server 2017  
- event_query-15.txt — SQL Server 2019  
- event_query-16.txt — SQL Server 2022  
- event_query-17.txt — SQL Server 2025  

The application determines the SQL Server version of each instance at runtime and automatically selects the most appropriate query file based on the mapping above. If no matching version-specific file is found, it falls back to the default event_query.txt

Permissions and Authentication

  • Authentication
    • SQLEventMonitor supports only Windows Integrated Security.
    • SQL Authentication is not supported.
  • Execution Account
    • The Windows account under which the SQLEventMonitor process runs must have:
      • Read and Write permissions on the target event repository database.
      • VIEW SERVER STATE permission on each monitored SQL Server instance.
      • Any additional permissions required by the specific diagnostic queries defined in "event_query.txt".
  • Notes
    • Permissions may vary depending on the monitoring queries you implement.
    • It is recommended to run SQLEventMonitor under a dedicated service account with only the required permissions for security best practices.

Configuring "event_config.txt":

The file event_config_sql.txt defines the core settings for how and where collected SQL Server event data will be stored, as well as how often servers are checked.

# Configuration
TARGET_DATABASE_SERVER=<EventWritingSQLServerInstance>
TARGET_DATABASE_NAME=dbSQLEvent
TARGET_SQLTABLE=tblSQLEvent

# How often to execute queries (in seconds)
NEXT_SERVER_CHECK_SEC=120

# How often to read event_server.txt to add/remove server
NEXT_SERVER_REFRESH_MIN=30

# Number of shared threads to execute queries against all servers.
MAX_CONCURRENT_THREADS=50
VERSION_CHECK_TIMEOUT_SEC=30
QUERY_EXECUTION_TIMEOUT_SEC=45


# Number of log files and size of each file
MAX_LOG_FILES=10
MAX_LOG_FILE_SIZE_MB=25

# Logging activities
# If set to NO, will log essential information and errors
WRITE_TO_LOG=NO
  • TARGET_DATABASE_SERVER: The SQL Server instance where all collected events will be written.
  • TARGET_DATABASE_NAME: The database name on the target server where events are stored.
  • TARGET_SQLTABLE: The table name within the target database that stores event records.
  • NEXT_SERVER_CHECK_SEC: The default interval (in seconds) between checks of each monitored server.

Configuring "event_server.txt"

The file event_server.txt defines the list of SQL Server instances to be monitored. Both default and named instances are supported. There is no limit to the number of servers that can be added – monitoring is virtually unlimited.

Format: Duration|SQLServerInstance

Parameter Details

  • Duration (optional)
    • The frequency (in seconds) at which query in "event_query.txt" will be executed against the target server.
    • If omitted, the default value from NEXT_SERVER_CHECK_SEC in "event_config.txt" will be used.
  • SQLServerInstance (mandatory)
    • The SQL Server instance name.
    • Can be a default instance (e.g., SRV001) or a named instance (e.g., SRV001\SQL2017).
    • IP addresses and server names are both supported.

Additional Guidelines for "event_server.txt":

  • One server per line: Each line must represent exactly one SQL Server, with or without a duration value.
  • Separator: Use the pipe character | to separate Duration and SQLServerInstance.
  • Comments: Use # at the beginning of a line to comment out a server.
  • Apply changes: After modifying this file, restart SQLEventMonitor.exe for the changes to take effect.
  • Logging: Check the \logs\ folder for detailed runtime information and error messages.

Example:

  1. 120|WIN251 -> Run query every 120 seconds against this default instance
  2. RDP80\SQL2022 -> Use global default interval for this named instance
  3. 30|WIN252 -> Run query every 30 seconds against this default instance
  4. WIN253 -> Use global default interval for this default instance
  5. 60|192.168.0.230 -> Run query every 60 seconds against this named instance

Figure #2: Running SQLEventMonitor.exe on the command prompt

Notes on Running as Windows Service:

Use NSSM (https://nssm.cc/) to create a Windows Service. Ensure that the service account has the necessary permissions to access both the monitored SQL Server instances and the event repository server.

Configuring "event_query.txt"

The file event_query_sql.txt contains the diagnostic T-SQL queries that SQLEventMonitor will execute against all listed SQL Server instances.

Key Requirements:

  • The file may contain one or more SELECT statements combined using UNION ALL.
  • Each SELECT statement must include the following columns:
    1. SourceName
    2. EventSubject
    3. EventType
    4. MessageText
  • If these columns are missing or misnamed, the query will fail.

Notes

  • Several production-ready queries are provided a separate "event_query_sql.txt" to detect common SQL Server issues so that you can start quickly.
  • These queries are designed with backward compatibility in mind.

Supplied Alerting Events in the diagnostic query:

The provided alerting queries will capture and generate the following events:

  1. Blocking detected
  2. Long-running active session detected
  3. Long-running idle transaction detected
  4. AG replica health issue detected
  5. tempdb space usage
  6. Database log usage alert
  7. tempdb latch contention
  8. Memory utilization
  9. Plan cache usage
  10. Pending I/O requests
  11. AG replica lag

These events cover a broad range of performance, availability, and resource utilization scenarios commonly encountered in SQL Server environments.

You are encouraged to add, update, or adjust queries in event_query_sql.txt to fit your unique operational and monitoring requirements.

Structure Example

SELECT SourceName, EventSubject, EventType, MessageText UNION ALL SELECT SourceName, EventSubject, EventType, MessageText UNION ALL SELECT SourceName, EventSubject, EventType, MessageText

Sample Structured Query Example:

SELECT 'SQLMonitor' AS SourceName, 'Service Broker Issue' AS EventSubject, 'Critical' AS EventType, 'Service broker has poisoned queue' AS MessageText UNION ALL SELECT 'SQLMonitor' AS SourceName, 'Blocking detected' AS EventSubject, 'Warning' AS EventType, 'SPID 55 is blocking 25 other sessions' AS MessageText UNION ALL So on

Quick Start – Email Alerts:

  • The PowerShell script SQLEvent_Monitor_Mail.ps1 sends email notifications based on the criteria defined in "eventAction_EventSubject.txt".
  • Before using the script, update the following parameters:
    • Alert Repository server
    • Table name
    • SMTP server configuration
    • Recipient email addresses
  • The script is designed to prevent duplicate or repetitive alerts. When run for the first time, it creates a file named "eventAction_LastEventID.txt" and records the current MAX(ID) from the alert table.
  • If you skipped running the script for a period and new records have accumulated, you may delete "eventAction_LastEventID.txt" to avoid sending old alerts.
  • Each time the script starts, it:
    • Reads the latest MAX(ID) from the alert table.
    • Updates or recreates "eventAction_LastEventID.txt" with the new value.
    • Processes and sends email alerts only for new records after the MAX(ID).

Customizing Email Alerts for SQLEvent_Monitor_Mail.ps1:

The configuration file eventAction_EventSubject.txt controls how and when email alerts are sent.

File format: Servers | EventName | Duration (in minutes)

Parameter Details

  • Servers (mandatory)
    • Use * to include all servers, or specify one or more server names separated by commas.
  • EventName (mandatory)
    • Must exactly match an event name defined in event_query.txt.
  • Duration (optional)
    • Defines a suppression window (in minutes).
    • This determines how frequently the script can send alerts for the same event.
    • Without a duration (*|EventName), alerts are sent every time the event occurs.

Examples of Customization:

  1. *|Blocking detected:
    • Monitors SQL blocking across all servers and sends alerts whenever blocking is detected.
  2. *|Blocking detected|10:
    • Monitors SQL blocking across all servers, but applies a 10-minute suppression window, preventing duplicate alerts within that time.
  3. SRV2700,SRVFIN\SQL2019|Blocking detected:
    • Excludes blocking alerts for these two servers.
    • Alerts will still be sent for all other servers.
  4. SRV0012,SRV0HR\SQL2022|Blocking detected|15:
    • Monitors blocking for all servers, but applies a 15-minute suppression window only to these two servers.
  5. SQLSRV314|tempdb space usage detected:
    • Suppresses tempdb space alerts permanently for this server.
  6. HR234,FIN450\SQL2017,SQLSRV314|AG replica lag:
    • Suppresses AG replica lag alerts for these three servers only.

Sample "eventAction_EventSubject.txt":

# Format: Servers|EventName|Duration # * = All servers # EventName = Exact name of event from event_query_sql.txt # Duration = Suppression window in minutes (optional) *|Blocking detected|5 *|Long running active session detected|10 *|Long running idle transaction detected|10 *|AG replica health issue detected *|tempdb space usage|10 *|Database log usage alert|15 *|tempdb latch contention|10 *|Memory utilization|30 *|Plan cache usage|30 *|Pending I/O requests *|AG replica lag # Alert suppression rules SRV123|tempdb space usage|10 SRV191,SRV380|Long running active session detected SRV191,SRV185,SRV310|Long running idle transaction detected SRV159,SRV348|Blocking detected SRV420|tempdb space usage detected SRV510|Blocking detected|15 SRV555\SQL2017,S081\SQL2016,SRV151|Long running active session detected SRV810,SRT351\FINSQL01|Long running idle transaction detected SRV555|Plan cache usage

Quick rules:

  • * in server field = applies to all servers.
  • No duration = permanent suppression.
  • With duration = rate-limiting (alerts only after N minutes).
  • Multiple servers can be listed with commas.
  • # skip the line to evaluate and to send email alert.
  • Subject match is substring/LIKE, not exact.

Conclusion:

I have worked on the Windows and SQL Server platform for many years, and during that time I have not found a lightweight, easy-to-configure tool that consistently delivers the desired results. While I am familiar with many commercial solutions, I often find them unnecessarily complex, slow to respond, prone to missing critical alerts, and demanding excessive hardware resources due to heavy data processing.

The tools I share here are the result of my personal initiative and hobbyist development. They have been running successfully in live production environments across 300+ servers for many years without a single issue. I hope you will find them equally useful in your own work. Thank you.

Saturday, August 9, 2025

WinEventMonitor - proactive, scalable, and free. Deploy once, monitor forever..

⬇ Download Now

WinEventMonitor – Watch Every Server, Catch Every Event, in Real Time, at Zero Cost

⬇ Download WinEventMonitor

Overview

WinEventMonitor is a real-time, multi-threaded Windows Event Subscription Processing Engine designed to monitor and process any event generated by Windows Server or Desktop systems — remotely and at scale. Built for large enterprise environments, it can seamlessly handle events from hundreds of servers simultaneously.

This out-of-the-box, extremely efficient solution requires no licensing fees and delivers immediate, actionable notifications, helping identify and address potential issues before they escalate.


What is WinEventMonitor?

At its core, WinEventMonitor features a WMI-based event subscription engine combined with powerful Regular Expression (RegEx) support, enabling it to parse everything from simple alerts to complex log entries.

  • Easy Configuration: Managed via a simple text file for quick customization and rapid deployment.
  • Flexible Storage: Supports SQL Server Express as a backend for event storage.
  • Automated Notifications: A PowerShell script can send email alerts automatically when events are written to the database.
  • Visualization: A custom dashboard can be implemented to provide real-time insights into events across critical servers.

No Installation Required

  • Delivered as a single executable file.
  • Can run in Command Prompt or as a Windows service.
  • No dependencies — fully portable across Windows environments.

Download

Download the zipped file from: https://bit.ly/3GFghZv

Update – 11 August 2025

1. New Flag in event_config.txt

Added a new configuration flag to control event processing behavior in the engine:

EVENT_PROCESS_ALL = No / Yes
  • EVENT_PROCESS_ALL = No
    The event engine will only process events listed in the event_filter.txt file.
  • EVENT_PROCESS_ALL = Yes
    The event engine will process all incoming events from the server.
    Note: For this to work, the event_filter.txt file must be empty. If any filters remain, this setting will have no effect.

2. Server Shutdown Event Enhancement

Added an additional check to verify whether a connected server has been triggered to shut down.

3. PowerShell Script Update

The PowerShell script now suppresses email alerts under the following conditions:

  • If the Event Name (Event Subject) contains one or more server names before a pipe (|).
  • If the Event Subject consists only of server names (no additional context).

In these cases, no email notifications will be sent for those server(s).

Note: This update improves event filtering logic and reduces unnecessary email alerts.

Screenshots:

Sample event capture and notification
Sample event notification
Sample email notification
On a Windows Command Prompt


Quick Start

  • Download and unzip the file.
  • Run the executable for the first time — it will create all supporting files.
  • Change parameters in event_config.txt.
  • Add servers in event_server.txt.
  • Add event names and Windows event messages in event_filter.txt.
  • Run again — it will start collecting Windows events.
  • Refer to the detailed explanation below for complete system usage.

Permissions

WinEventMonitor has built-in subscriptions to the following Windows Event Logs: Application, System, Setup, and Security.

SQL Server Permissions

  • Read and Write access to the target SQL Server database.

Windows Permissions

  • WMI Access: Remote Enable, Execute Methods, Enable Account, and Read Security permissions for the root\cimv2 namespace.
  • Group Membership: Member of the Event Log Readers group.
  • Firewall: Enable the WMI-In firewall rule.
  • DCOM: Remote Launch and Remote Activation permissions in DCOM configuration.
  • Security Log Access: Grant SeSecurityPrivilege (Manage auditing and security log).
  • Remote Access: Ensure the account can connect via RPC/DCOM to target hosts.

Account Requirements

  • Must be a domain account — username and password authentication method is not supported.

First Run

Assuming you have downloaded the provided ZIP file to a folder named C:\WinEventMonitor, follow these steps:

  1. Open a Command Prompt.
  2. Change the directory to C:\WinEventMonitor.
  3. If the ZIP file has not yet been extracted, extract it now. This will produce the following files and folders:

Core Files and Folders

  • Logs – Stores WinEventMonitor’s log files.
  • event_server.txt – Contains a list of Windows servers from which WinEventMonitor will collect log entries.
  • event_filter.txt – Contains a list of event names and messages to collect from Windows servers.
  • event_config.txt – The main configuration file.
  • event_sql_table_script.txt – A SQL script to create the required table in a SQL Server database.

Email Notification

  • WinEventMonitor.ps1 – PowerShell script for sending email notifications.
  • eventAction_EventSubject.txt – List of event names that will trigger specific email notifications sent by the PowerShell script.
  • eventAction_LastWinEventID.txt – Stores the last processed event ID from the SQL Server table (tblWinEvent).

Details on event_server.txt

This file contains the names or IP addresses of the servers to be monitored.

  • Any server or IP address commented out with a # will be ignored during the next refresh cycle.

Details on event_filter.txt

This file contains event names and Windows messages to be monitored.

  • Structure: CustomEventName|Message1|Message2|Message3|Message4,...
  • The first section before the first pipe (|) is treated as the event name (event subject).
  • Each subsequent Message(x) is treated as a separate message but linked to the same event name.
  • Messages can contain Regular Expressions for advanced parsing. WinEventMonitor supports all standard RegEx syntax.

Configuration File – event_config.txt

ParameterDescription
DUPLICATE_SUPPRESSION_INTERVAL_SEC = 10Suppresses duplicate events for the specified number of seconds. If set to 0, every event is processed. Duplicate detection is based on the first part of each entry in server_filter.txt.
THREAD_RESTART_DELAY_SEC = 60Time (in seconds) to wait before attempting to reconnect to a disconnected server.
THREAD_RESTART_RETRY = 5Number of reconnection attempts before giving up.
THREAD_ACTIVITY_TO_LOG_FILE = NoReserved for future use. Currently has no effect.
SERVER_REFRESH_INTERVAL_MIN = 30Interval (in minutes) to refresh the server list. Changes in event_server.txt take effect at the next refresh.
FILTER_REFRESH_INTERVAL_MIN = 30Interval (in minutes) to reload event filters after changes in event_filter.txt.
SQLSERVER_NAME = localhostSQL Server instance name. For default instances, specify the server name (e.g., FinanceSQL2022). For named instances, use ServerName\Instance (e.g., ServerABC\HRSQL927).
SQLSERVER_DATABASE = dbWinEventName of the SQL Server database (default: dbWinEvent).
SQLSERVER_TABLE = tblWinEventName of the SQL Server table (default: tblWinEvent).
EVENT_PROCESS_ALL = No / YesTo control event processing behavior in the engine, selected or all events (default: No).

Sample Files Provided

  • server_filter.txt – Contains over 150 predefined event names and messages.
  • eventAction_EventSubject.txt – Contains event names used by the PowerShell script to determine which events trigger email notifications.

Running WinEventMonitor

As a Windows Service

Use NSSM to create a Windows service for WinEventMonitor.

  • Run the service under a Windows domain account with the required permissions to access Windows Event Logs and SQL Server.

From the Command Prompt

Ensure event_server.txt and event_filter.txt are configured before starting. Two modes are available:

  1. With “No” clause
    WinEventMonitor.exe No
    Logs all events to the \logs\ folder without writing to SQL Server.
  2. Without “No” clause
    WinEventMonitor.exe
    Runs in non-interactive mode and writes events to SQL Server (if configured).

Log Management

Logs are stored in the \logs\ folder. WinEventMonitor automatically retains only the last 10 log files.


PowerShell Script for Email Notifications

A provided PowerShell script (WinEvent_Monitor_Mail.ps1) runs continuously, monitoring the SQL Server table for new events.

  • When a new event is found (based on the table’s identity column), it sends an email if the event subject matches an entry in eventAction_EventSubject.txt.
  • Subjects can be excluded from notifications by commenting them out with #.
  • The subject must match exactly the first part of the corresponding entry in server_filter.txt (before the pipe |).
  • After processing an event, the script updates eventAction_EventSubject.txt with the last processed event ID.

Note: Adjust the parameters at the top of the PowerShell script as needed.


Built-in Alerts

WinEventMonitor includes built-in alerts to detect Windows shutdown events by default. When triggered, alerts are recorded in both the SQL table and the log file.

  • RPC failed
  • The remote procedure call failed
  • The RPC server is unavailable
  • System shutdown event triggered
  • Windows Server is shutting down
  • Windows Server is unavailable
  • Windows Server shutdown
⬇ Download WinEventMonitor

Wednesday, July 9, 2025

🔍 Introducing WinDigger — Your Go-To Windows & SQL Server Diagnostic Companion

WinDigger is my latest creation—a lightweight, portable tool purpose-built for Windows Server and SQL Server environments. Whether you're a seasoned sysadmin, DBA, administrator, or just curious about system internals, WinDigger empowers you to explore, analyze, and act—remotely and efficiently.


⚙️ What Makes WinDigger Stand Out?

Unlike many bloated commercial tools, WinDigger requires no installation, no external dependencies, and leaves no footprint. Just launch it—locally or remotely—and you’re ready to go.

This utility uncovers deep system insights, surfaces hidden problems, and enables you to take immediate action—all in one place. Designed for educational and charitable use, WinDigger is completely free.

  • No installation
  • No admin agents or services
  • No hidden telemetry or licensing

🔧 Feature Highlights

  • Process Management: View and terminate processes on remote systems.
  • Windows Services Control: Start, stop, disable, or restart any service remotely.
  • Disk & Storage Analysis: Get full visibility into physical drives, partitions, and controllers.
  • Network Diagnostics: Inspect adapters, routing tables, active connections, and configurations.
  • Windows Event Viewer: Access logs, hotfixes, reliability reports, and reboot status.
  • Active Directory Queries: Fetch user and group information via LDAP/ADSI.
  • Failover Cluster Insights: Review cluster health and configuration parameters.
  • Scheduled Tasks: List, disable, delete, or trigger tasks across the network.
  • VMware Awareness: Analyze vCPU/vSocket layout and receive optimization tips.
  • Local Admin Management: Remotely manage members of the local Administrators group.
  • WMI Repair Tools: Rebuild WMI, restore performance counters, and restart COM+ services.
  • Run As Different User: Launch external apps under alternate credentials.
  • ... and more! Regular updates bring new features and enhancements.

🔐 Administrator Privileges Required

WinDigger uses system-level access through WMI, PowerShell, LDAP, and COM interfaces. To ensure full functionality, please run the executable as Administrator. Without elevated privileges, some features may not work as expected.


⚠️ Anti-Virus Notice

WinDigger is distributed in two formats:

  • Compressed (UPX-packed)
  • Uncompressed (Raw EXE)

Some antivirus software may flag the compressed version due to heuristics. This is a common issue with portable system tools. If flagged, use the uncompressed version or add an exclusion.


📥 Download WinDigger

🔗 Download WinDigger

Includes both compressed and uncompressed versions.

Last upload date: 04 August 2025

Changes made: v2025.08.04

  • Added Availability Groups
  • Added SQL Server Permissions
  • Added SQL Server tabs: Databases, Backups, workload per databases
  • SQL Server detection on a remote server
  • SQL Server Connection using Windows and SQL Authentication
  • Various UI improvement

🖼️ Screenshots

Below are some example screenshots of WinDigger in action:

Windows Failover Cluster overview

Disk Drives


🙌 Why I Built This

WinDigger was created to give back to the community—especially those who want to learn more about the systems they manage. Whether you're debugging a complex issue or just exploring, this tool is designed to simplify the journey.

If you find WinDigger useful, please consider sharing the link or leaving feedback below.


💬 Feedback or Suggestions?

I welcome your feedback! Drop a comment on this post or reach out directly for feature requests, ideas, or contributions.

Friday, January 26, 2024

split_part(): Extracting the nth Delimited Substring

In many RDBMS there is a split_part() function which is used to split a string into multiple parts based on a delimiter and return a specific part of the split result. Generally, it takes three arguments: the input string, the delimiter, and the position of the desired part, start from the left of the string.

In SQL Server, there are no such direct function exists, however there is a function called string_split which can be used to achieve the same result.

Let’s say we want to extract a specific nth delimited substring from a string which are stored in a column, and let’s consider the following SQL Code to create delimited column for demonstration purpose. 

 
CREATE TABLE #tmp ( lname VARCHAR(256) )

INSERT #tmp SELECT 'How,will,we,use,our,increasing,scientific,knowledge' AS lname
INSERT #tmp SELECT 'He,has,a,limited,knowledge,of,English' AS lname
INSERT #tmp SELECT 'The,owner,claims,the,boat,was,being,used,without,her,knowledge' AS lname
INSERT #tmp SELECT 'Applicants,should,have,a,working,knowledge' AS lname
INSERT #tmp SELECT 'judging,from,my,personal,experience,and,information' AS lname
INSERT #tmp SELECT 'Such,situations,require,fundamental,knowledge ' AS lname

SELECT * FROM #tmp
 

T-SQL Solution:

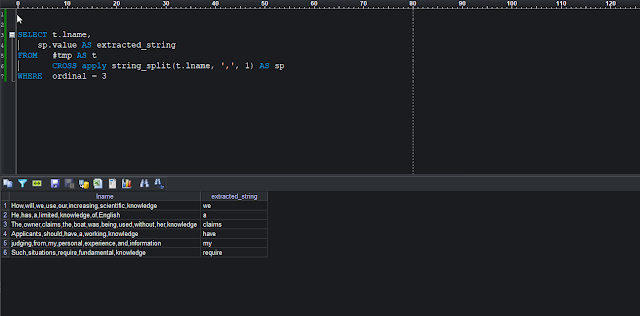
To extract the nth delimited substring from the column “lname”, we can use the CROSS APPLY along with the string_split function. If we want to extract 3rd substring from the “lname” column, we can simply write the following T-SQL code:

 
SELECT t.lname,
    sp.value AS lextract
FROM   #tmp AS t
       CROSS apply string_split(t.lname, ',', 1) AS sp
WHERE  ordinal = 3

Using CROSS APPLY with string_split buit-in function

If we want extract 6th delimited substring, then we need to simply use the ordinal value equal to 6, for example:

 
SELECT t.lname,
    sp.value AS lextract
FROM   #tmp AS t
       CROSS apply string_split(t.lname, ',', 1) AS sp 
WHERE  ordinal = 6
 

Creating a split_part function from starting SQL Server 2016:

We can create a similar function such as PostgreSQL or Snowflake in SQL Server, which can be used in similar way.


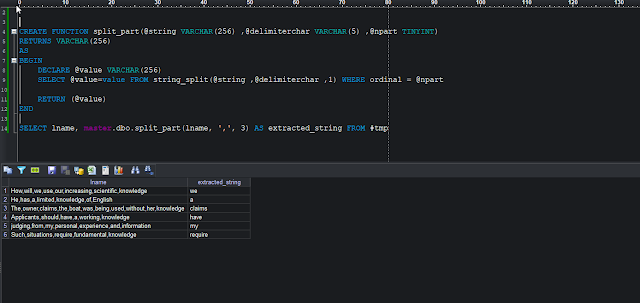
CREATE FUNCTION split_part(@string VARCHAR(256) ,@delimiterchar VARCHAR(5) ,@npart TINYINT)
RETURNS VARCHAR(256)
AS
BEGIN
    DECLARE @value VARCHAR(256)
    SELECT @value=value FROM string_split(@string ,@delimiterchar ,1) WHERE ordinal = @npart
   
    RETURN (@value)
END

-- Calling the split_part function:

SELECT master.dbo.split_part(lname, ',', 3) FROM #tmp

Using a custom function split_part

Creating split_part using XML functionality – will work from SQL 2005:

 
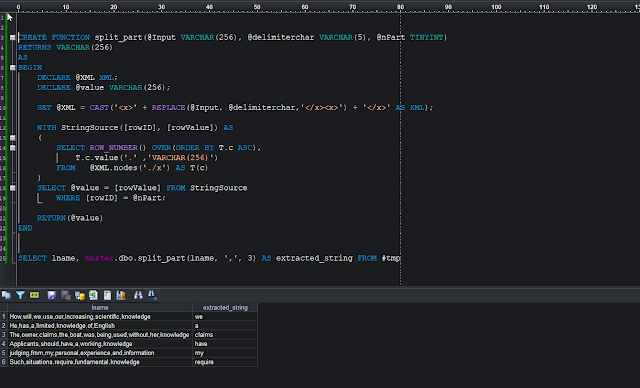
CREATE FUNCTION split_part(@Input VARCHAR(256), @delimiterchar VARCHAR(5), @nPart TINYINT)
RETURNS VARCHAR(256)
AS
BEGIN
    DECLARE @XML XML;
    DECLARE @value VARCHAR(256);
           
    SET @XML = CAST('<x>' + REPLACE(@Input, @delimiterchar,'</x><x>') + '</x>' AS XML);
           
    WITH StringSource([rowID], [rowValue]) AS
    (
        SELECT ROW_NUMBER() OVER(ORDER BY T.c ASC),
            T.c.value('.' ,'VARCHAR(256)')
        FROM   @XML.nodes('./x') AS T(c)
    )
    SELECT @value = [rowValue] FROM StringSource
        WHERE [rowID] = @nPart;
       
    RETURN(@value)
END

-- Calling the split_part function:

SELECT master.dbo.split_part(lname, ',', 3) AS [extracted_string] FROM #tmp

Using a XML based custom function split_part

Further reading:


STRING_SPLIT (Transact-SQL):
https://learn.microsoft.com/en-us/sql/t-sql/functions/string-split-transact-sql?view=sql-server-ver16

PostgreSQL: String Functions and Operators:
https://www.postgresql.org/docs/9.1/functions-string.html